Outlier Detection
A former colleague asked about outlier detection and deletion. This is a topic dear to my heart, and there are a lot of misconceptions floating around. Most importantly, people don’t realise how valuable a signal outliers are. They may be the most important part of your data, and meaningful analysis is often impossible until you have handled them properly – which does not mean blindly deleting them!
The best summary in this area I know of is Donald Wheeler’s two-part series in Quality Digest1 This is behind a registration wall, but registration is fairly painless.:
Some important passages follow, but if this is important to you too, read the full articles by Donald Wheeler. In fact, if this is important to you, read anything you can get your hands on by Donald Wheeler.
Throughout this article, any emphasis in the quotes is mine.
The problem in general
If the outliers are simply anomalies created by the measurement process, then they should be deleted before proceeding with the computations. But if the outliers are signals of actual changes in the underlying process represented by the data, then they […] suggest that some important variables have been overlooked. Here the deletion of the outliers will not result in insight. Instead, insight can only come from identifying why the unexpected changes happened.
The purpose of analysis is insight, but what insight can be gained if we ignore signals of a change? […] To paraphrase George Box, if you discover silver while digging for gold, stop and mine the silver.
Outliers should not be assumed to be noise. A lot of the time, they are actually the signal we should be looking for.2 At least to begin with. Once we fully understand the source of the outliers – and have made the adjustments needed to avoid it contaminating our data in the first place – search for further signals in the remaining data can proceed.
The problem with deleting the outliers to obtain a homogeneous data set is that the resulting data set will no longer belong to this world. If the analysis of a purified data set ignores the assignable causes that lurk behind most outliers the results will not apply to the underlying process that produces the data. The real question about outliers is not how to get them out of the data, but why do they exist in the first place.
In this author’s 50 years of experience in helping people analyze data, the more profound question has always been “Why are there outliers?” rather than “What do we find when we delete the outliers?”
So, rather than arguing over which outlier test to use, it is better to [detect] fewer outliers and to discover what happened to create those outliers than it is to [detect] more outliers and delete them in order to analyze data that no longer describe reality.
We may only have resources to dig into the causes behind a small number of outliers, so we shouldn’t stress out if our detection method only finds a small number of them. We can learn a lot from understanding the source of just one or two outliers – more than we learn by blindly deleting them.
Summary of common tests
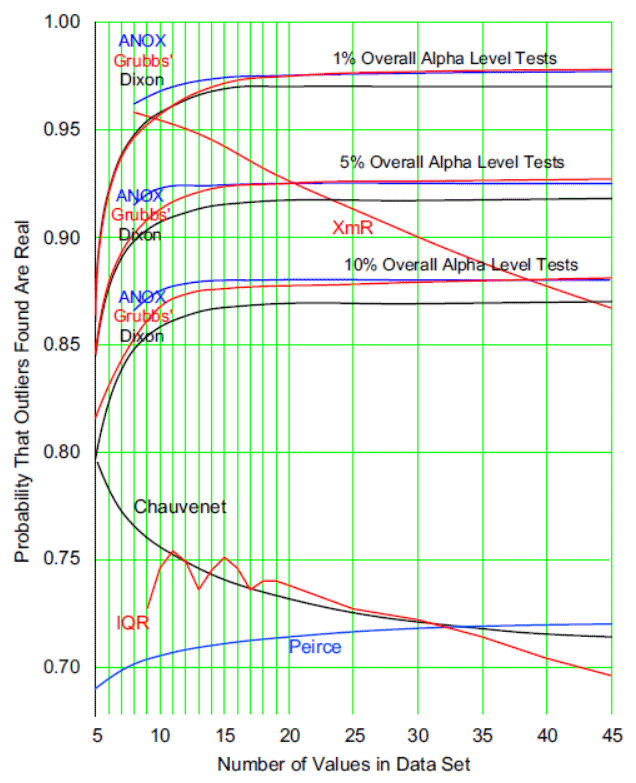
Procedures that try to capture all of the outliers will go overboard and include good data in the dragnet along with the outliers. […] this is what happens with Peirce’s test, Chauvenet’s test, and the IQR test.
Good engineering tip #9421: everything is a tradeoff. Especially something like this, where gunning for a low false negative rate is going to make the false positive rate shoot through the roof. This is a mathematical inevitability, and has nothing to do with what techniques we are using.
Procedures that keep the overall alpha level reasonably small will still find the major outliers without an undue increase in risk of false alarms. As shown, the XmR test, ANOX, Grubbs’ test, and the Dixon and W-ratio tests all fall into this category.
There are many more tests for outliers, some with sopisticated mathematical theory behind them. Undoubtedly more tests will be created in the future. Many of these will follow Peirce and Chauvenet down the rabbit hole of trying to find all of the outliers so as to obtain a purified data set for their analysis. However, information theory places an upper bound on how much can be extracted from a given data set, and adding more tests will not change this upper bound. ANOX, Grubbs, Dixon, and the W-ratio all approach this upper bound. Other tests can do no better.
On tests based on a control chart
So, the baseline portion of an XmR chart is not only easier to use than Peirce’s test, Chauvenet’s test, or the IQR test, but it also outperforms them. The XmR chart simply does a better job of striking a balance between the twin errors of missing a signal and getting a false alarm. The baseline portion of an XmR chart provides a test for outliers that allows you to have confidence in the results. If you want simplicity with superior performance, the XmR chart may be all you need.
The original articles in Quality Digest have a very informative picture here that I’m not sure I’m allowed to reproduce, but surely there can be no harm in linking to it while it’s still up.
If you don’t know how to construct an XmR chart – you’re in luck: I know a great guide for that.
On the drawbacks of popular methods
Peirce’s criterion is so focused on finding outliers that, when k > 1, everything begins to look like an outlier. And when k = 1 the excessive overall alpha levels undermine the likelihood that a point identified as an outlier is actually an outlier. If you are looking for an explanation for the outliers this wastes time and effort, and if you are deleting the outliers this results in the deletion of good data.
Chauvenet’s criterion is only slightly more conservative than Peirce’s criterion for k = 1. It suffers from the same problems. It does a very poor job of separating the interesting outliers from the non-outliers. Again, while this test is being used today, it should not be. It has nothing to recommend it except the window dressing of apparent mathematical rigor.
The IQR test avoids the tables of scaling constants by using fixed-width limits. However this simplicity is offset by the inherent uncertainty in the quartile statistics. The result being a test that in practice performs very much like both Peirce’s test and Chauvenet’s test.
Again, see the picture referenced above for a graphical view of these problems.
On methods with fixed alpha levels
The convergence between the curves for the ANOX and Grubbs’ tests tells us that they are going to perform an equivalent job in practice. Dixon’s curves (and those for the W-ratio which are not shown) are slightly below the other curves because they look for gaps instead of extreme values. However, the similarity of all these curves implies that these fixed overall alpha level tests all operate close to the absolute limit of what can be extracted from the data.
This means that other tests for detecting outliers simply cannot do any better job than these three approaches. While other tests may be dressed in different formulas, they will ultimately be either equivalent to ANOX, Grubbs, and Dixon, or they will be inferior to ANOX, Grubbs, and Dixon.
For example the modified Thompson’s tau test is simply Grubbs’ test performed with an overall alpha level that is n times larger than Grubbs’ overall alpha level. As may be seen in figure 11, the effect of increasing the overall alpha level is to lower the PPV curve. Thus, the modified Thompson’s tau test is going to always be inferior to Grubbs’ test. It may find more potential outliers, but it will also have an excessive number of false alarms, undermining your faith in the reality of the potential outliers while removing good data. Such is the quid pro quo required of all such tests.
I think this is a particularly elegant result. I love it when there are theoretical upper bounds to things and you just can’t do better than that. Then you don’t have to worry – you just use the best method available.